Market Closes - September 11, 2012
Posted on Sep 11, 2012
November Soybeans are sitting right at chart support so a bearish report could lead to significant losses.
Live Cattle futures closed higher with the biggest gains in October and December – both of these contracts moved to new highs, prices not seen since the end of March 2012. Futures were supported by optimism for cash cattle prices. The October contract is already at a premium to the cash price so further gains may be limited until trade develops in the Plains. Boxed beef values did move higher today.
Lean Hog futures closed mostly lower as focus returned to the weak cash fundamentals.
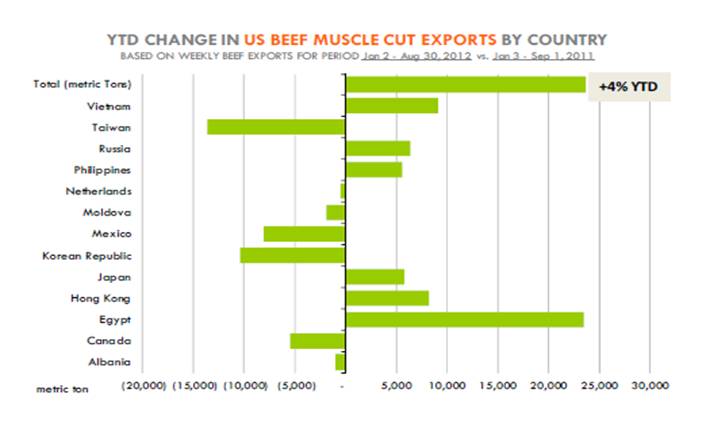
Chart Source: Daily Livestock Report, CME Group, September 11, 2012
** USDA report at 8:30 a.m. Eastern **
Corn Dec -5.5 778; Mar -6 781; Dec’13 -1.5 655
Bean Nov -17 1701.5; Mar -14 1649; Nov’13 -8 1347 Meal -3 518 Oil -67 5547
Wheat Dec -6 884; Jly -2.5 864 KC -.5 904; MGE unch 935
LC Oct +135 12710; Feb +30 13257; Apr +10 13612
FC Sep -30 14465; Nov -17 14790; Mar -7 15230
LH Oct +15 7272; Dec -15 7142; Apr -132 8445
Milk Sep +3 1881; Oct +19 1920
Oats +1 387
Rice -5 1472
US$ -.7%
Dow +69 13323
SP +4 1434
NAS +1 3105
Tran +35 5133
VIX +.13 16.41
WTI +35 9689
Brent +28 11509
Gas +2.4 305
NG +19 300
HO +1.5 318
Eth -2 245.5
Gold +2 1732
Slvr -18 3340
2-yr unch 0.250%
5-yr +.026 0.665%
10yr +.046 1.700%
30yr +.047 2.853%
Trade Expectations for the USDA Crop Report Corn Production = 10.38 billion with average yield of 120.6 bushels. 2012/13 Ending Stocks = 592 million vs 650 million in August.
Soybean Production = 2.66 billion bushels with average yield of 35.8 bushels/acre. 2012/13 Ending Stocks = 106 million vs 115 million in August.
Wheat 2012/13 Ending Stocks = 709 million
Tagged Post Topics Include: Economics, Market updates
Comments